
So, I keep getting "faked out" by what seems to be an early O---low temps after period ends, then a huge spike that seems like I have O'd much earlier than I usually do. It's happened so often, that when my temp spiked 3 days ago, I took it for granted. But then I thought....hmm, I wonder if this pattern could give me a heads up to when I might O!
So I created an overlay of "average" charts and I did identify a pattern.
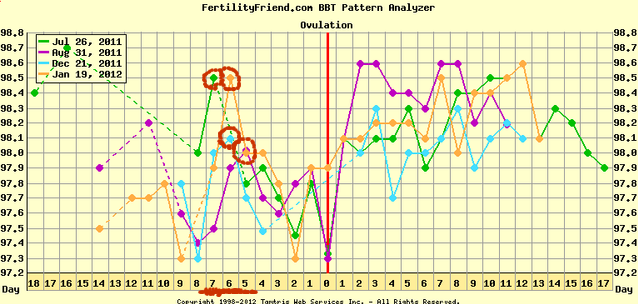
I identified the highest temp that spiked after AF and before O. (circled in red) You'll see that of the 4 cycles I identified, the highest temp spike occured 5-7 days before O was identified. So, with that logic, looking at my current cycle...
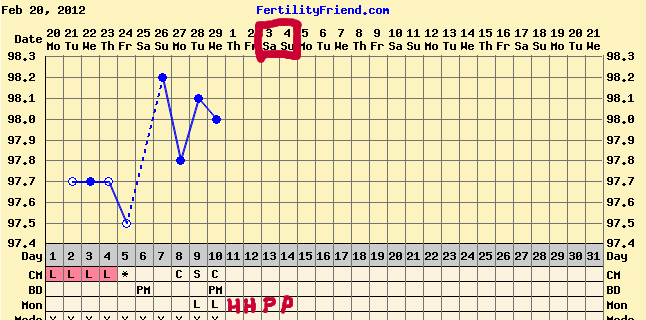
It looks like if O could be 6-7 days from now, it could occur CD13-14 (Sat Mar 3or Sun Mar 4). If that is the case, then if we make sure to BD starting today and for the next 5 days, we could easily catch O! We'll see if my theory holds true! Either way, I'll still be using my CBEFM to track it.


2 comments:
That is really interesting! I hope you catch the eggie!
Me too! You should see my update...I'm about to post it. I'm just so amazed, I don't have to feel angst over what my temps are doing spiking so early! I know not every woman has a clear defined pattern this way, and it isn't guaranteed, but still cool!
Post a Comment