
Just to update! Day 3 of the Five temp challenge. My Day 3 temp is: 98.6
Since I started taking my temp more regularly, this has appeared above my chart:
Note: Your chart data does not allow ovulation to be pinpointed to within a 24 hour timeframe.
Your temperature suggests, however, that ovulation may have occured between CD 19 and CD 24.

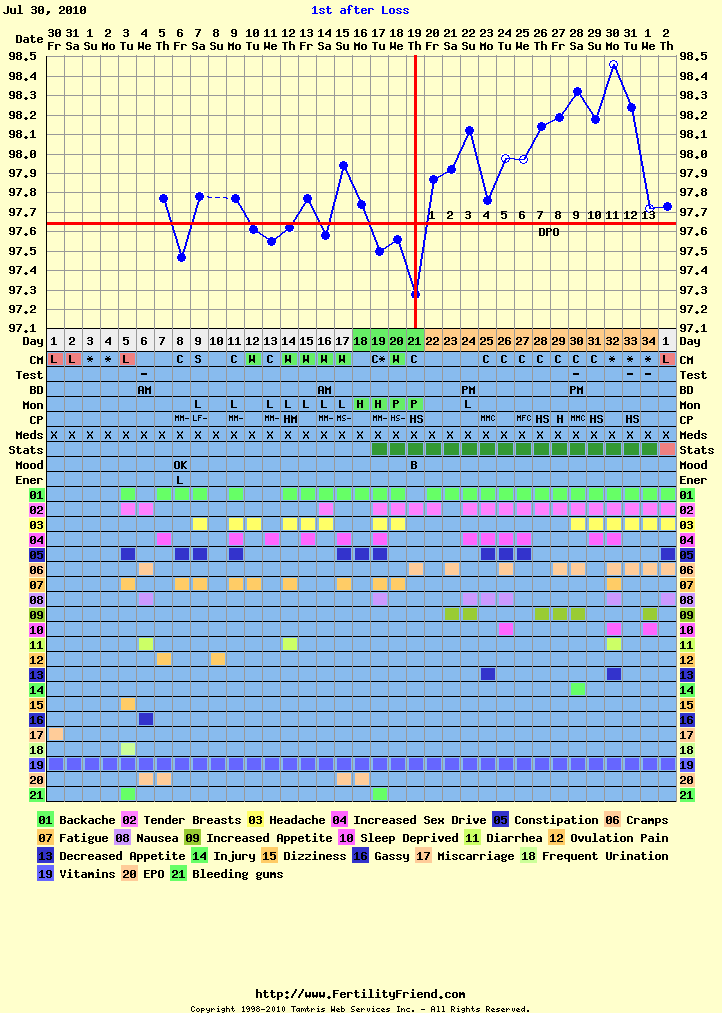
Anyhow, this months chart, with ovulation so up in the air, yes, it is possible that CD19 was my O date. If you look at my cervical fluid on my chart, however, you'll notice that the fertile CM ends 2 days before the temp on CD19. Knowing that I have a classic fall back rise, and that in the past my O has been confirmed on the last day or next to last day of fertile CM, one could assume that the low temp on CD19 is indeed a fallback temp. This would mean my ovulation was more likely to occur on CD17.
But....all of this is theory right now, since I didn't take data to know one way or the other on those days. Ce la vie. Two more temps and I can test!
Since I started taking my temp more regularly, this has appeared above my chart:
Note: Your chart data does not allow ovulation to be pinpointed to within a 24 hour timeframe.
Your temperature suggests, however, that ovulation may have occured between CD 19 and CD 24.
Hmmmmm....I see why it says this; I have a large dip in temps on CD19 (98.2) and then my next temp 2 days later is 98.7, a big climb. If we take ovulation to be the earliest day in the range, CD19, this still gives me a fair chance of pregnancy (3 days before O). If ovulation is CD20 or later, I'm screwed.

BUT! One thing about charting for so long is that I get to know my pattern. Some women have no particular pattern to their luteal phase temps. The pattern most women want to see is what we call triphasic. Most charts are biphasic, meaning the first phase (follicular) has a set of temps in a lower range and then the temperature shifts into a second phase of higher temps (luteal phase). Many women who become pregnant have a third phase, where within the luteal phase, their set of temperatures jumps to a higher range of temps.
The more common ovulatory patterns are: slow rise, stair step rise, and fall back rise. A slow rise is as it sounds, the temp jump being just barely 2/10ths or more, then rising slowly. Stair step rise is a version of the slow rise, where you have a rise, then a temp about even, then another jump and so forth.
A fall back rise occurs when you have a high jump indicating ovulation, then between 2-4 days past ovulation, your temp falls back to or below coverline. After the fall, it generally rises back up to the level it was previously.
My charts, in general, are a classic fallback rise. I will generally see a fallback temp between 2-4 DPO and have had one as late as 5 DPO (any later it starts to be a dip due to the corpus luteum failing and/or implantation if you're pregnant).
Here are some examples:


Anyhow, this months chart, with ovulation so up in the air, yes, it is possible that CD19 was my O date. If you look at my cervical fluid on my chart, however, you'll notice that the fertile CM ends 2 days before the temp on CD19. Knowing that I have a classic fall back rise, and that in the past my O has been confirmed on the last day or next to last day of fertile CM, one could assume that the low temp on CD19 is indeed a fallback temp. This would mean my ovulation was more likely to occur on CD17.
But....all of this is theory right now, since I didn't take data to know one way or the other on those days. Ce la vie. Two more temps and I can test!


No comments:
Post a Comment